
Sean Weldon
September 11, 2026
10
min. read
and updated on:
September 24, 2026



At its heart, evidence-based UX is the discipline of validating design decisions through real-world user metrics and direct qualitative feedback rather than relying on ungrounded aesthetic preferences. Visual appeal is important, but visual polish without functional clarity is just expensive digital decoration. When teams design without data, they fall into subjective traps where the loudest voice in the room—or the highest-paid person's opinion—dictates the interface architecture.
Mastering a modern Data-Driven User Experience requires understanding that we are never our own end users. What seems natural, clean, and intuitive to an internal design team can introduce confusing roadblocks for a first-time customer trying to complete a checkout or configure a dashboard.
Whether you are honing your skills through academic training in UI/UX or leading an enterprise product team, ground every interaction in measurable behavior. The World Economic Forum ranks human-centered design among the fastest-growing skill areas through 2030, projecting a massive 45% job growth across design professions. Backing creative instinct with empirical data is the single most valuable capability a modern product team can develop.
While the terms are often used interchangeably, there is a vital distinction between being purely metric-driven and operating with a data-informed mindset.
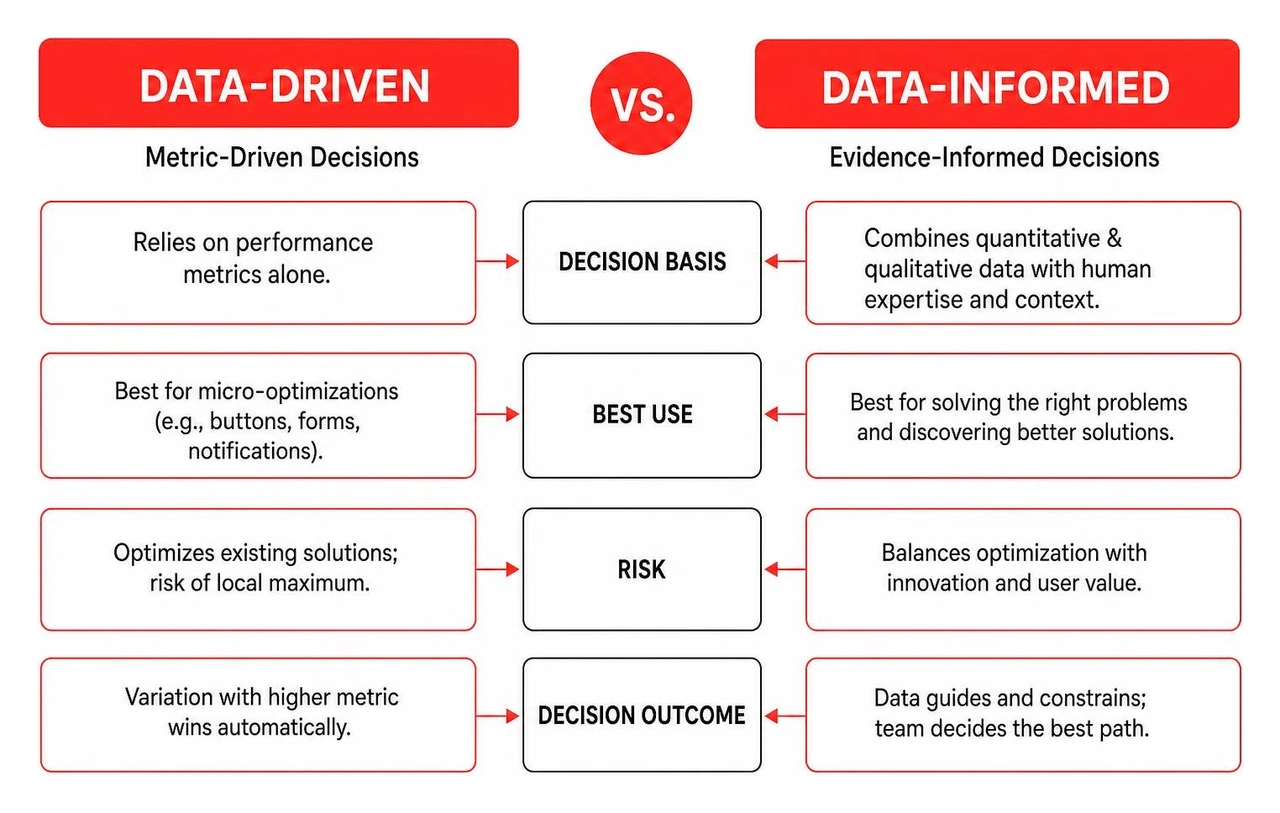
In a pure data-driven model, performance metrics alone make the call. If button variation A generates a 2% higher click-through rate than variation B, variation A automatically wins. This approach works well for micro-optimizations like checkout buttons, form field ordering, or notification timing. However, relying solely on numbers can lead teams into a local maximum trap—optimizing an existing, sub-optimal layout so heavily that they miss the larger, disruptive innovations needed to transform the product experience.
Data-informed design, on the other hand, treats quantitative and qualitative data as essential inputs alongside designer empathy, brand strategy, technical feasibility, and business context. High-performing teams leverage data to identify the right problems, set clear constraints, and evaluate performance, while utilizing creative human problem-solving to invent elegant solutions.
Achieving true product clarity requires balancing both quantitative and qualitative insights. Relying exclusively on one creates dangerous blind spots.
Quantitative data provides objective numerical measurements. It captures event telemetry, scroll depth, bounce rates, conversion funnels, and task completion times. It tells you what is happening across your product at scale. For example, your analytics might reveal that 40% of users drop off on the third step of an onboarding wizard.
Qualitative data uncovers subjective motivations, emotional reactions, and mental models. Through contextual user interviews, open-ended feedback surveys, and moderated usability testing, qualitative research explains why that drop-off occurs. It might reveal that the third step asks for sensitive information before explaining the value proposition.
Adopting a comprehensive user-centered design approach means triangulating these methods. Usability pioneer Jakob Nielsen established that testing with as few as 5 representative users can uncover approximately 80% of usability issues. Combining small-scale qualitative testing with large-scale telemetry validation lets you pinpoint friction points and resolve them before writing production code.
To build a reliable data foundation, product teams must capture clear user telemetry across every stage of the customer journey. Having the right instrumentation makes it easy to diagnose bottlenecks, spot navigational dead-ends, and systematically enhance website user experience.
Tracking behavioral telemetry allows product designers to see beyond what users say and observe what they actually do. Essential data sources include:
To prevent analysis paralysis, teams need structured frameworks that organize raw analytics into actionable product insights.
Conduct regular metric audits to separate vanity metrics (such as total pageviews or registered accounts) from actionable metrics (such as time-to-first-value and checkout completion rates). A good rule of thumb: if a metric changes, it should point directly to a clear, user-centric product decision.
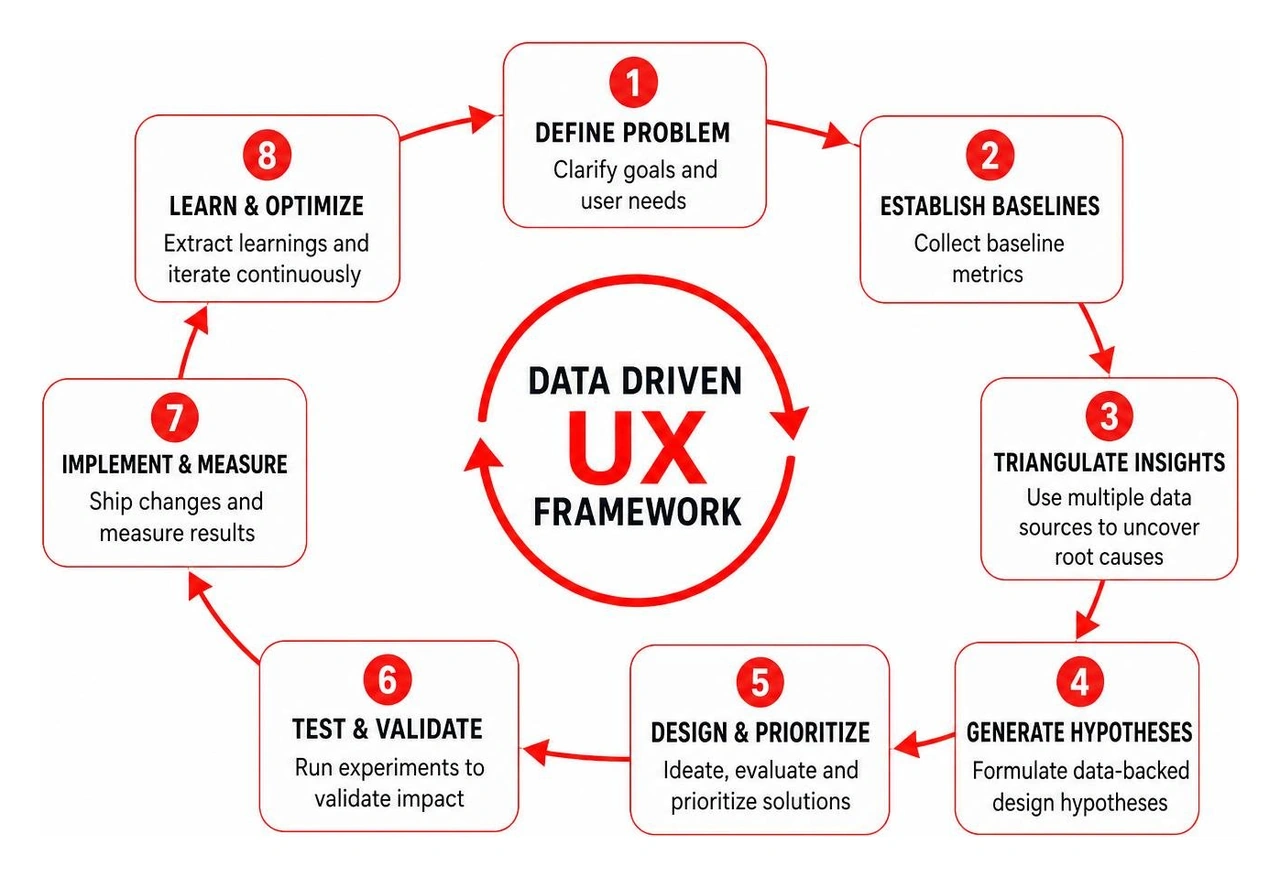
Transforming your product process into an evidence-based engine requires an end-to-end framework that links early discovery to continuous post-launch optimization. Structuring your sprints around structured hypotheses ensures every build step supports measurable business value when engineering data-driven software.
Every successful design initiative begins with rigorous problem definition rather than premature wireframing:
Once the core problem is clear, the focus shifts to designing, validating, and shipping tested solutions:

Transitioning to evidence-based design brings tremendous advantages, but it also introduces real operational challenges. Navigating these obstacles requires strong discipline, smart tooling, and an ongoing commitment to product strategy.
A common danger in data-centric teams is falling victim to confirmation bias—cherry-picking user metrics that confirm initial assumptions while ignoring contradictory signals. Pre-register your design hypotheses, sample sizes, and success criteria before launching user studies or split tests.
Watch out for short-term conversion traps. A pop-up modal or aggressive banner might boost newsletter signups by 15% this week, but it can degrade long-term brand trust and increase customer churn over six months.
Always balance metrics with creative problem-solving. Great design prioritizes the obvious over the clever, ensuring intuitive design principles resolve complex workflows without requiring users to overthink basic actions. Data defines the boundaries and illuminates the problems; creative intuition provides the breakthrough solutions.
Strict adherence to data privacy regulations (such as GDPR and CCPA) is equally vital. Always anonymize user recordings, obtain explicit consent, and avoid manipulative dark patterns designed to artificially inflate short-term metrics at the expense of user trust.
Artificial intelligence has evolved data-driven UX from a retrospective reporting tool into a forward-looking, real-time optimization system. Across modern digital experience platforms, AI accelerates every phase of user research and validation:
Data is the ultimate bridge between UX design teams and executive leadership. When presenting design proposals to executive stakeholders, replace subjective design critiques with clear business narratives.
Frame design choices around metrics executives care about: conversion rates, user acquisition costs, retention cohorts, and revenue impact. Presenting qualitative video clips of real users struggling through a workflow alongside hard conversion funnel data neutralizes internal bias and builds immediate consensus.
Store your research in shared, traceable repositories where every wireframe decision links back to original user quotes or analytics logs. Cultivate a test-and-learn culture where disproven hypotheses are celebrated as valuable lessons that protect your team from shipping costly mistakes.
Data-driven UX design relies strictly on empirical metrics to dictate the final decision—for example, choosing a winning button layout based entirely on split-test conversion rates. Data-informed UX design treats metrics as one vital input alongside designer empathy, strategic brand vision, contextual factors, and technical feasibility. Most high-performing product teams operate with a data-informed approach to foster long-term innovation.
Startups with low traffic volumes cannot easily run statistically significant A/B tests, but they can still operate with data. Focus on low-sample qualitative usability testing (testing with 5 users uncovers 80% of major usability issues), run remote first-click tests on navigation trees, deploy targeted micro-surveys at key moments, and utilize AI synthetic testing to validate prototypes before writing code.
In 2026, AI automates the most time-consuming research bottlenecks. It transcribes and synthesizes qualitative feedback, predicts user drop-off points through predictive behavioral models, enables rapid synthetic prototype testing, and powers dynamic interfaces that adapt to user preferences in real time.
Transforming your user experience from an educated guess into an evidence-based revenue engine requires deep strategic insight, world-class UI design, and seasoned engineering execution.
At Bolder Apps, founded in 2019 and named top software and app development agency in 2026 by DesignRush (verify details on bolderapps.com), we help high-growth companies build intuitive, market-dominating mobile and web applications. We eliminate project risk through our transparent fixed-budget model, combining an in-shore CTO who guides your product strategy with elite senior offshore engineering teams—all backed by clear, milestone-based payments. No junior developers learning on your dime.
Ready to build exceptional, metric-backed digital experiences that delight users and drive real business growth? Explore our end-to-end UI/UX design services and contact our team across our global office locations today to schedule your strategic product consultation.
At its heart, evidence-based UX is the discipline of validating design decisions through real-world user metrics and direct qualitative feedback rather than relying on ungrounded aesthetic preferences. Visual appeal is important, but visual polish without functional clarity is just expensive digital decoration. When teams design without data, they fall into subjective traps where the loudest voice in the room—or the highest-paid person's opinion—dictates the interface architecture.
Mastering a modern Data-Driven User Experience requires understanding that we are never our own end users. What seems natural, clean, and intuitive to an internal design team can introduce confusing roadblocks for a first-time customer trying to complete a checkout or configure a dashboard.
Whether you are honing your skills through academic training in UI/UX or leading an enterprise product team, ground every interaction in measurable behavior. The World Economic Forum ranks human-centered design among the fastest-growing skill areas through 2030, projecting a massive 45% job growth across design professions. Backing creative instinct with empirical data is the single most valuable capability a modern product team can develop.
While the terms are often used interchangeably, there is a vital distinction between being purely metric-driven and operating with a data-informed mindset.
In a pure data-driven model, performance metrics alone make the call. If button variation A generates a 2% higher click-through rate than variation B, variation A automatically wins. This approach works well for micro-optimizations like checkout buttons, form field ordering, or notification timing. However, relying solely on numbers can lead teams into a local maximum trap—optimizing an existing, sub-optimal layout so heavily that they miss the larger, disruptive innovations needed to transform the product experience.
Data-informed design, on the other hand, treats quantitative and qualitative data as essential inputs alongside designer empathy, brand strategy, technical feasibility, and business context. High-performing teams leverage data to identify the right problems, set clear constraints, and evaluate performance, while utilizing creative human problem-solving to invent elegant solutions.
Achieving true product clarity requires balancing both quantitative and qualitative insights. Relying exclusively on one creates dangerous blind spots.
Quantitative data provides objective numerical measurements. It captures event telemetry, scroll depth, bounce rates, conversion funnels, and task completion times. It tells you what is happening across your product at scale. For example, your analytics might reveal that 40% of users drop off on the third step of an onboarding wizard.
Qualitative data uncovers subjective motivations, emotional reactions, and mental models. Through contextual user interviews, open-ended feedback surveys, and moderated usability testing, qualitative research explains why that drop-off occurs. It might reveal that the third step asks for sensitive information before explaining the value proposition.
Adopting a comprehensive user-centered design approach means triangulating these methods. Usability pioneer Jakob Nielsen established that testing with as few as 5 representative users can uncover approximately 80% of usability issues. Combining small-scale qualitative testing with large-scale telemetry validation lets you pinpoint friction points and resolve them before writing production code.
To build a reliable data foundation, product teams must capture clear user telemetry across every stage of the customer journey. Having the right instrumentation makes it easy to diagnose bottlenecks, spot navigational dead-ends, and systematically enhance website user experience.
Tracking behavioral telemetry allows product designers to see beyond what users say and observe what they actually do. Essential data sources include:
To prevent analysis paralysis, teams need structured frameworks that organize raw analytics into actionable product insights.
Conduct regular metric audits to separate vanity metrics (such as total pageviews or registered accounts) from actionable metrics (such as time-to-first-value and checkout completion rates). A good rule of thumb: if a metric changes, it should point directly to a clear, user-centric product decision.
Transforming your product process into an evidence-based engine requires an end-to-end framework that links early discovery to continuous post-launch optimization. Structuring your sprints around structured hypotheses ensures every build step supports measurable business value when engineering data-driven software.
Every successful design initiative begins with rigorous problem definition rather than premature wireframing:
Once the core problem is clear, the focus shifts to designing, validating, and shipping tested solutions:
Transitioning to evidence-based design brings tremendous advantages, but it also introduces real operational challenges. Navigating these obstacles requires strong discipline, smart tooling, and an ongoing commitment to product strategy.
A common danger in data-centric teams is falling victim to confirmation bias—cherry-picking user metrics that confirm initial assumptions while ignoring contradictory signals. Pre-register your design hypotheses, sample sizes, and success criteria before launching user studies or split tests.
Watch out for short-term conversion traps. A pop-up modal or aggressive banner might boost newsletter signups by 15% this week, but it can degrade long-term brand trust and increase customer churn over six months.
Always balance metrics with creative problem-solving. Great design prioritizes the obvious over the clever, ensuring intuitive design principles resolve complex workflows without requiring users to overthink basic actions. Data defines the boundaries and illuminates the problems; creative intuition provides the breakthrough solutions.
Strict adherence to data privacy regulations (such as GDPR and CCPA) is equally vital. Always anonymize user recordings, obtain explicit consent, and avoid manipulative dark patterns designed to artificially inflate short-term metrics at the expense of user trust.
Artificial intelligence has evolved data-driven UX from a retrospective reporting tool into a forward-looking, real-time optimization system. Across modern digital experience platforms, AI accelerates every phase of user research and validation:
Data is the ultimate bridge between UX design teams and executive leadership. When presenting design proposals to executive stakeholders, replace subjective design critiques with clear business narratives.
Frame design choices around metrics executives care about: conversion rates, user acquisition costs, retention cohorts, and revenue impact. Presenting qualitative video clips of real users struggling through a workflow alongside hard conversion funnel data neutralizes internal bias and builds immediate consensus.
Store your research in shared, traceable repositories where every wireframe decision links back to original user quotes or analytics logs. Cultivate a test-and-learn culture where disproven hypotheses are celebrated as valuable lessons that protect your team from shipping costly mistakes.
Data-driven UX design relies strictly on empirical metrics to dictate the final decision—for example, choosing a winning button layout based entirely on split-test conversion rates. Data-informed UX design treats metrics as one vital input alongside designer empathy, strategic brand vision, contextual factors, and technical feasibility. Most high-performing product teams operate with a data-informed approach to foster long-term innovation.
Startups with low traffic volumes cannot easily run statistically significant A/B tests, but they can still operate with data. Focus on low-sample qualitative usability testing (testing with 5 users uncovers 80% of major usability issues), run remote first-click tests on navigation trees, deploy targeted micro-surveys at key moments, and utilize AI synthetic testing to validate prototypes before writing code.
In 2026, AI automates the most time-consuming research bottlenecks. It transcribes and synthesizes qualitative feedback, predicts user drop-off points through predictive behavioral models, enables rapid synthetic prototype testing, and powers dynamic interfaces that adapt to user preferences in real time.
Transforming your user experience from an educated guess into an evidence-based revenue engine requires deep strategic insight, world-class UI design, and seasoned engineering execution.
At Bolder Apps, founded in 2019 and named top software and app development agency in 2026 by DesignRush (verify details on bolderapps.com), we help high-growth companies build intuitive, market-dominating mobile and web applications. We eliminate project risk through our transparent fixed-budget model, combining an in-shore CTO who guides your product strategy with elite senior offshore engineering teams—all backed by clear, milestone-based payments. No junior developers learning on your dime.
Ready to build exceptional, metric-backed digital experiences that delight users and drive real business growth? Explore our end-to-end UI/UX design services and contact our team across our global office locations today to schedule your strategic product consultation.
At its heart, evidence-based UX is the discipline of validating design decisions through real-world user metrics and direct qualitative feedback rather than relying on ungrounded aesthetic preferences. Visual appeal is important, but visual polish without functional clarity is just expensive digital decoration. When teams design without data, they fall into subjective traps where the loudest voice in the room—or the highest-paid person's opinion—dictates the interface architecture.
Mastering a modern Data-Driven User Experience requires understanding that we are never our own end users. What seems natural, clean, and intuitive to an internal design team can introduce confusing roadblocks for a first-time customer trying to complete a checkout or configure a dashboard.
Whether you are honing your skills through academic training in UI/UX or leading an enterprise product team, ground every interaction in measurable behavior. The World Economic Forum ranks human-centered design among the fastest-growing skill areas through 2030, projecting a massive 45% job growth across design professions. Backing creative instinct with empirical data is the single most valuable capability a modern product team can develop.
While the terms are often used interchangeably, there is a vital distinction between being purely metric-driven and operating with a data-informed mindset.
In a pure data-driven model, performance metrics alone make the call. If button variation A generates a 2% higher click-through rate than variation B, variation A automatically wins. This approach works well for micro-optimizations like checkout buttons, form field ordering, or notification timing. However, relying solely on numbers can lead teams into a local maximum trap—optimizing an existing, sub-optimal layout so heavily that they miss the larger, disruptive innovations needed to transform the product experience.
Data-informed design, on the other hand, treats quantitative and qualitative data as essential inputs alongside designer empathy, brand strategy, technical feasibility, and business context. High-performing teams leverage data to identify the right problems, set clear constraints, and evaluate performance, while utilizing creative human problem-solving to invent elegant solutions.
Achieving true product clarity requires balancing both quantitative and qualitative insights. Relying exclusively on one creates dangerous blind spots.
Quantitative data provides objective numerical measurements. It captures event telemetry, scroll depth, bounce rates, conversion funnels, and task completion times. It tells you what is happening across your product at scale. For example, your analytics might reveal that 40% of users drop off on the third step of an onboarding wizard.
Qualitative data uncovers subjective motivations, emotional reactions, and mental models. Through contextual user interviews, open-ended feedback surveys, and moderated usability testing, qualitative research explains why that drop-off occurs. It might reveal that the third step asks for sensitive information before explaining the value proposition.
Adopting a comprehensive user-centered design approach means triangulating these methods. Usability pioneer Jakob Nielsen established that testing with as few as 5 representative users can uncover approximately 80% of usability issues. Combining small-scale qualitative testing with large-scale telemetry validation lets you pinpoint friction points and resolve them before writing production code.
To build a reliable data foundation, product teams must capture clear user telemetry across every stage of the customer journey. Having the right instrumentation makes it easy to diagnose bottlenecks, spot navigational dead-ends, and systematically enhance website user experience.
Tracking behavioral telemetry allows product designers to see beyond what users say and observe what they actually do. Essential data sources include:
To prevent analysis paralysis, teams need structured frameworks that organize raw analytics into actionable product insights.
Conduct regular metric audits to separate vanity metrics (such as total pageviews or registered accounts) from actionable metrics (such as time-to-first-value and checkout completion rates). A good rule of thumb: if a metric changes, it should point directly to a clear, user-centric product decision.
Transforming your product process into an evidence-based engine requires an end-to-end framework that links early discovery to continuous post-launch optimization. Structuring your sprints around structured hypotheses ensures every build step supports measurable business value when engineering data-driven software.
Every successful design initiative begins with rigorous problem definition rather than premature wireframing:
Once the core problem is clear, the focus shifts to designing, validating, and shipping tested solutions:
Transitioning to evidence-based design brings tremendous advantages, but it also introduces real operational challenges. Navigating these obstacles requires strong discipline, smart tooling, and an ongoing commitment to product strategy.
A common danger in data-centric teams is falling victim to confirmation bias—cherry-picking user metrics that confirm initial assumptions while ignoring contradictory signals. Pre-register your design hypotheses, sample sizes, and success criteria before launching user studies or split tests.
Watch out for short-term conversion traps. A pop-up modal or aggressive banner might boost newsletter signups by 15% this week, but it can degrade long-term brand trust and increase customer churn over six months.
Always balance metrics with creative problem-solving. Great design prioritizes the obvious over the clever, ensuring intuitive design principles resolve complex workflows without requiring users to overthink basic actions. Data defines the boundaries and illuminates the problems; creative intuition provides the breakthrough solutions.
Strict adherence to data privacy regulations (such as GDPR and CCPA) is equally vital. Always anonymize user recordings, obtain explicit consent, and avoid manipulative dark patterns designed to artificially inflate short-term metrics at the expense of user trust.
Artificial intelligence has evolved data-driven UX from a retrospective reporting tool into a forward-looking, real-time optimization system. Across modern digital experience platforms, AI accelerates every phase of user research and validation:
Data is the ultimate bridge between UX design teams and executive leadership. When presenting design proposals to executive stakeholders, replace subjective design critiques with clear business narratives.
Frame design choices around metrics executives care about: conversion rates, user acquisition costs, retention cohorts, and revenue impact. Presenting qualitative video clips of real users struggling through a workflow alongside hard conversion funnel data neutralizes internal bias and builds immediate consensus.
Store your research in shared, traceable repositories where every wireframe decision links back to original user quotes or analytics logs. Cultivate a test-and-learn culture where disproven hypotheses are celebrated as valuable lessons that protect your team from shipping costly mistakes.
Data-driven UX design relies strictly on empirical metrics to dictate the final decision—for example, choosing a winning button layout based entirely on split-test conversion rates. Data-informed UX design treats metrics as one vital input alongside designer empathy, strategic brand vision, contextual factors, and technical feasibility. Most high-performing product teams operate with a data-informed approach to foster long-term innovation.
Startups with low traffic volumes cannot easily run statistically significant A/B tests, but they can still operate with data. Focus on low-sample qualitative usability testing (testing with 5 users uncovers 80% of major usability issues), run remote first-click tests on navigation trees, deploy targeted micro-surveys at key moments, and utilize AI synthetic testing to validate prototypes before writing code.
In 2026, AI automates the most time-consuming research bottlenecks. It transcribes and synthesizes qualitative feedback, predicts user drop-off points through predictive behavioral models, enables rapid synthetic prototype testing, and powers dynamic interfaces that adapt to user preferences in real time.
Transforming your user experience from an educated guess into an evidence-based revenue engine requires deep strategic insight, world-class UI design, and seasoned engineering execution.
At Bolder Apps, founded in 2019 and named top software and app development agency in 2026 by DesignRush (verify details on bolderapps.com), we help high-growth companies build intuitive, market-dominating mobile and web applications. We eliminate project risk through our transparent fixed-budget model, combining an in-shore CTO who guides your product strategy with elite senior offshore engineering teams—all backed by clear, milestone-based payments. No junior developers learning on your dime.
Ready to build exceptional, metric-backed digital experiences that delight users and drive real business growth? Explore our end-to-end UI/UX design services and contact our team across our global office locations today to schedule your strategic product consultation.