
Shawn G
November 10, 2026
10
min. read
and updated on:
November 10, 2026



The Ansoff growth strategy helps you choose how to grow by asking two questions: Is the product new or existing? Is the market new or existing? The answers point to four options:
Risk generally rises as you move away from products and customers you know. Use the matrix to sort your ideas, then test the strongest options against your budget, skills, and customer demand. It shows where the uncertainty lies; it does not make the decision for you.

Understanding these growth pathways connects directly to executing a broader brand expansion strategy, refining your core product strategy, and aligning long-term initiatives with an overarching corporate brand strategy.
Every business hits an inflection point where baseline organic momentum flattens out. At this stage, leadership teams often find themselves bombarded with hundreds of competing ideas: launching new features, entering international markets, opening new sales channels, or acquiring adjacent businesses. Without a structured framework to filter these options, companies risk spreading their capital, engineering bandwidth, and executive attention far too thin.
The Ansoff matrix was created to solve this challenge. First formulated by Russian-American applied mathematician and business strategist H. Igor Ansoff in his 1957 Harvard Business Review foundational paper for Diversification, the framework remains one of the most enduring models in strategic management. As highlighted in the Wiley Encyclopedia of Management on product market expansion, the grid serves as a forcing mechanism that isolates commercial expansion choices along two fundamental operational axes: products and markets.
At its core, the framework categorizes growth initiatives into four distinct quadrants based on whether a firm is working with existing or new assets across both dimensions:
Applying this matrix requires grounding your choices in an empirical, data-driven product strategy. When you map your growth bets honestly, you can immediately identify whether an initiative deepens your current operational moats or pulls your organization into unfamiliar territory.
The core insight behind the Ansoff framework is not simply categorization; it is risk visibility. Growth moves along a clear diagonal risk gradient. As you transition from the upper-left quadrant (Market Penetration) toward the lower-right quadrant (Diversification), strategic uncertainty compounds exponentially.
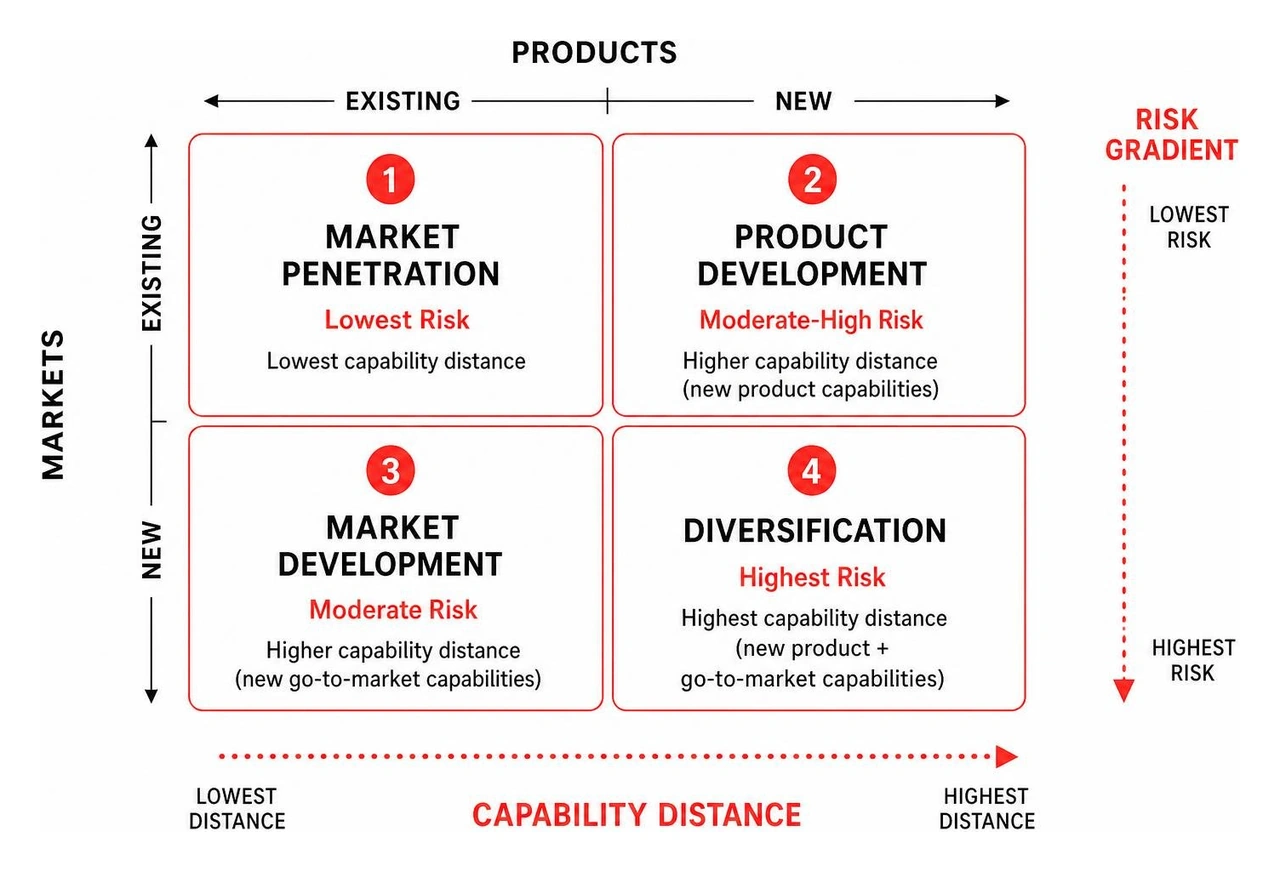
This compounding risk is driven by capability distance—the operational gap between what your organization does proficiently today and the new competencies required to succeed in a new endeavor.
Understanding this gradient allows executive teams to balance risk-return profiles, ensuring high-risk bets are subsidized by stable cash flows from the core business.

To see how the Ansoff framework operates in practice, we can examine how market leaders systematically leverage each quadrant—and what happens when they fail to respect the underlying risk dynamics.
Market penetration is the pursuit of market share expansion within an existing customer base using existing products. It is the least disruptive and most cost-effective path to scale because customer acquisition patterns, supply chains, and technical architectures are already operational.
Starbucks provides a masterclass in market penetration through aggressive retail store clustering. Rather than immediately expanding into unrelated retail categories, Starbucks historically blanketed dense urban areas with multiple storefronts on single city blocks. While critics initially feared cannibalization, this tactic saturated foot-traffic bottlenecks, shortened consumer wait times, squeezed out local competitors, and maximized local brand dominance.
To execute market penetration effectively, companies generally leverage a mix of operational levers:
Market development involves taking your proven product into brand-new customer segments, industrial verticals, or geographic markets. The offering itself remains fundamentally stable, but the go-to-market engine must adapt to new buyer behavior, local laws, and alternative sales funnels.
A classic example of market development is Unilever’s Project Shakti in rural India. Facing saturated urban centers, Unilever realized that hundreds of millions of prospective consumers lived in remote villages unreachable through traditional retail logistics. Rather than re-engineering their soap and hygiene products, Unilever designed an innovative direct-to-consumer distribution network by training tens of thousands of rural women as micro-entrepreneurs. These local brand ambassadors sold existing Unilever staples directly within their own communities.
Successfully entering new segments requires a structured approach to distribution channels marketing. When taking a product into new territories, businesses must also align their messaging with a comprehensive brand expansion strategy to ensure core brand equity translates across geographic and cultural borders.
Product development occurs when a company builds new products, features, or service extensions tailored specifically to its existing customer base. This approach exploits established customer trust, distribution channels, and brand loyalty while demanding continuous innovation and engineering output.
Amazon’s launch of the Kindle e-reader in 2007 serves as an archetypal product development move. Amazon had already established itself as the world’s leading online book retailer with millions of avid, book-buying customers. Instead of simply selling more physical paperbacks, Amazon invested heavily in proprietary hardware and e-ink display technologies to build a digital reading device. Because the target audience was already buying books on Amazon, the distribution channel was built-in, resulting in a market-defining hardware ecosystem.
Executing within this quadrant requires tight customer feedback loops, sustained R&D investment, and a disciplined new product launch strategy. Companies must ensure that new feature sets solve genuine user friction rather than complicating the core value proposition.
Diversification involves introducing completely new products into completely new markets. It represents the highest risk profile in strategic planning because the organization cannot rely on existing customer relationships or established product capabilities.
Diversification generally falls into two distinct categories:
In the early 2000s, Amazon realized it had developed world-class internal infrastructure to manage its surging e-commerce traffic. Recognizing that other businesses needed scalable server infrastructure, Amazon launched AWS in 2006. This was a radical departure: selling enterprise infrastructure-as-a-service (new product) to software engineering teams and corporations (new market). By early 2024, AWS had achieved a $100 billion annual revenue run rate, proving that when an organization uncovers deep operational synergies, related diversification can redefine an enterprise.
When diversification ignores operational reality, value destruction is swift and brutal:
These empirical examples demonstrate why diversification must never be treated as an experimental whim. It demands extreme strategic discipline, clear synergy validation, and rigorous risk containment.

Transforming the Ansoff Matrix from an academic diagram into an actionable growth engine requires a repeatable operational process. Executive teams must audit their current portfolio, screen emerging ideas, establish validation thresholds, and pace their capital deployment.
To deploy the Ansoff framework within your organization, follow this six-step execution process:
While the Ansoff Matrix offers exceptional strategic clarity, relying on it in isolation can lead to costly miscalculations. Watch out for these common implementation pitfalls:
To protect your strategic planning against these blind spots, pair the Ansoff matrix with established analytical frameworks:
Long-term commercial resilience is not about chasing every market trend; it is about methodically sequencing your risk. By utilizing the Ansoff framework to evaluate product-market decisions, leadership teams can clearly separate low-risk operational optimization from high-stakes exploratory bets. When you balance high-performing core operations with measured, validated product expansions, you create a self-funding growth engine that compounds enterprise value over time.
Turning strategic growth options into high-impact digital applications requires flawless technical execution and seasoned product leadership. Founded in 2019 and recognized as the top software and app development agency in 2026 by DesignRush, Bolder Apps helps organizations design, engineer, and scale market-defining web and mobile products.
Whether you are executing a core product enhancement or architecting an entirely new digital platform, our unique delivery model provides you with dedicated US-based executive technical leadership paired with senior distributed engineering teams. Operating on a transparent fixed-budget model with milestone-based payments, we ensure your strategic vision is brought to life efficiently, on time, and with zero junior developers learning on your dime.
Ready to engineer your next strategic growth initiative? Explore our comprehensive digital product development services or connect with our leadership team through our regional offices and locations to turn your product roadmap into reality.
Diversification is universally recognized as the riskiest quadrant. Because it requires entering an unfamiliar market with a completely new product offering, an organization faces dual uncertainty. You have no established customer relationships, unproven distribution channels, and no operational muscle memory for building and supporting the new product. If unexpected market headwinds or operational snags emerge, the lack of foundational expertise dramatically elevates the probability of catastrophic capital loss.
The difference lies entirely in the target audience. In market penetration, you sell your existing product to your current, established customer base—focusing on expanding market share, improving retention, increasing usage frequency, or capturing competitor accounts. In market development, you take that same existing product and introduce it to an unserved market. This might involve expanding geographically (e.g., launching an American SaaS platform in Europe), targeting a new demographic (e.g., selling enterprise software to small businesses), or opening completely new sales channels.
Yes, but startups must apply the framework with intense anti-diversification discipline. Early-stage startups rarely possess the capital, engineering bandwidth, or operational capacity to pursue multiple quadrants simultaneously. For founders, the Ansoff Matrix serves primarily as a guardrail against premature diversification. A startup should generally focus 90% or more of its energy on market penetration—achieving true product-market fit and dominating a tight niche—before testing product development or market development adjacencies.